


Gantt Chart Mastery: A Clear Guide to Project Timelines
Picture this. You’re managing a high-stakes project. Multiple teams are involved. Deadlines are fast approaching. Resources are limited. Stakeholders expect regular updates. In such a situation, one tool stands out as your silent partner in achieving clarity and control—the Gantt Chart.
Simple in design but powerful in application, a Gantt Chart gives you a visual timeline of your entire project. It helps you plan, organize, and track tasks, dependencies, and milestones with accuracy. Whether you’re managing a software development cycle, constructing a building, or launching a marketing campaign, this tool keeps your team aligned and your goals on track.
Let’s walk through how Gantt Charts work, why they’re essential for modern project management, and how to use them to structure timelines that drive seamless execution.
What is a Gantt Chart?
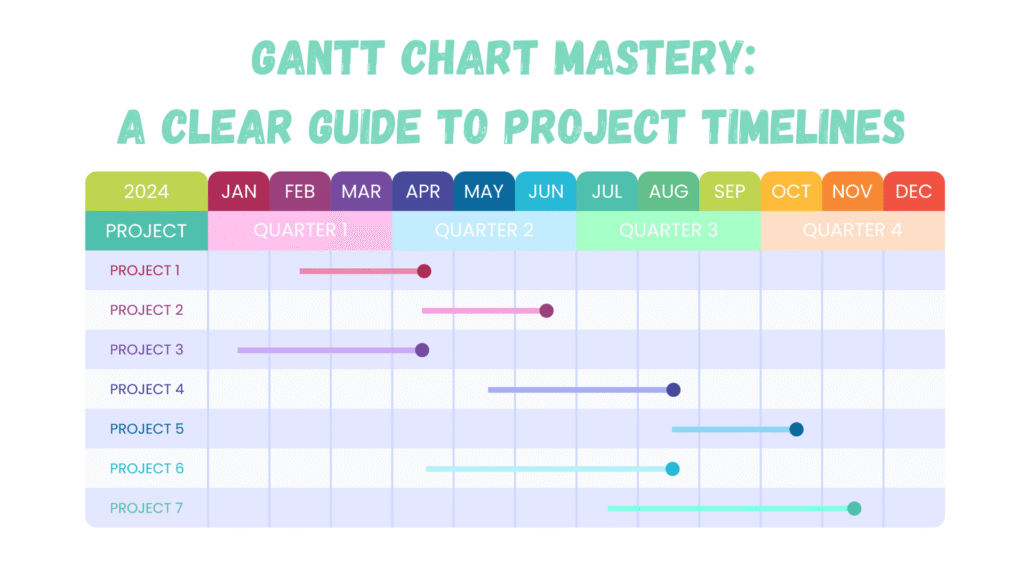
A Gantt Chart is a horizontal bar chart used in project management. Each bar represents a task or activity over time. The chart includes task names, start and end dates, durations, and dependencies. It shows what needs to be done, when, and by whom.
Originally developed by Henry Gantt in the early 1900s, this method has evolved into one of the most widely adopted tools in project planning. Modern digital Gantt Charts are interactive, collaborative, and integrated with task management, making them even more useful in complex environments.
Why Gantt Charts Work So Well
Gantt Charts are effective because they offer clarity through structure. They turn a tangled list of activities into a visual schedule, making it easier to:
- See how tasks align over time
- Identify overlaps or bottlenecks
- Allocate resources efficiently
- Track progress with real-time updates
- Communicate the project status to stakeholders
The format appeals to both strategic planners and hands-on team members. Managers can see the big picture, while team leads can zoom into weekly workloads. It becomes a shared reference point for decision-making.
Core Elements of a Gantt Chart
To use a Gantt Chart effectively, it’s essential to understand its foundational elements. These components are more than just visual features. They’re the moving parts that bring structure, transparency, and coordination to your project timeline.
Let’s dive into each of them in detail:
1. Tasks
Tasks are the building blocks of a Gantt Chart. Each task represents a specific unit of work that needs to be completed to move the project forward. Ideally, tasks should be:
- Actionable: Clear enough that a team member knows exactly what needs to be done
- Time-bound: With a defined start and end date
- Assignable: So it’s easy to track ownership and accountability
When breaking down a project, the goal is to reach a level where tasks are neither too broad nor too granular. Think of each task as one clear step in a larger journey.
Example:
If you’re managing a product launch, your tasks might include:
- Conducting competitor analysis
- Designing the user interface
- Writing onboarding emails
- Preparing a press kit
- Hosting a launch webinar
Each of these tasks may later break into subtasks, but at the Gantt Chart level, they define your roadmap clearly.
2. Timeline
The timeline stretches horizontally across the top (or bottom) of the Gantt Chart and represents the entire project duration. It’s typically divided into units such as:
- Days
- Weeks
- Months
- Quarters
The scale depends on your project’s length and complexity. A short-term sprint may use days or hours, while a long-term infrastructure rollout may span several quarters.
The timeline allows you to visualize when each task begins and ends. It also enables you to quickly spot:
- Time overlaps between tasks
- Gaps or unused time
- Conflicts in task sequencing
- Upcoming deadlines or crunch periods
It’s the backbone of your scheduling, helping you transition from planning to execution with confidence.
3. Bars
Bars are the heart of the Gantt Chart’s visual system. Each bar represents a task plotted against the timeline, with its length showing how long the task is expected to take.
Key elements of the bars include:
- Start Point: When the task is scheduled to begin
- End Point: When the task is expected to finish
- Length: Indicates the task’s duration
- Color Coding (optional): Can signify task category, status, or team ownership
A longer bar means a longer task. Overlapping bars indicate parallel activities. Staggered bars often show sequencing and flow.
In many tools, bars are interactive. You can drag to extend duration, shift dates, or even mark progress by shading a portion of the bar to reflect percentage completion.
4. Dependencies
Dependencies describe the logical relationships between tasks. They define how one task is connected to another, especially when one cannot begin until another is completed or initiated.
Without tracking dependencies, you risk delays, resource conflicts, and execution errors.
Gantt Charts make dependencies visual through lines or arrows connecting tasks. These connections guide the sequence and highlight critical paths.
Common types of dependencies include:
- Finish-to-Start (FS): The most common. Task B can only start after Task A finishes.
Example: You can’t begin development until the design is complete. - Start-to-Start (SS): Task B can begin once Task A begins.
Example: As soon as writing begins, editing can also start. - Finish-to-Finish (FF): Task B finishes when Task A finishes.
Example: Customer support wrap-up ends when user onboarding ends. - Start-to-Finish (SF): Less common. Task B must finish before Task A can start.
Example: A legacy system must remain active until the new system goes live.
By mapping dependencies, you gain foresight into cascading effects. If one task gets delayed, you can instantly see which downstream tasks may be affected and adjust accordingly.
5. Milestones
Milestones are symbolic markers in a project. They highlight important achievements, decision points, or deliverables that indicate meaningful progress. Unlike tasks, milestones have no duration, they’re events, not activities.
Examples of milestones:
- Finalizing the project charter
- Securing client approval on a prototype
- Completing Phase 1 of development
- Reaching product launch date
In the Gantt Chart, milestones often appear as diamonds or symbols placed along the timeline. Their presence helps teams stay focused on key outcomes and align around shared checkpoints.
Milestones serve several purposes:
- They help communicate progress to stakeholders in a clear, digestible way
- They break long projects into manageable segments
- They offer natural points to review, reassess, and realign project direction
While milestones don’t drive task duration, they drive motivation. They act as rallying points and recognition opportunities, each one a flag marking how far the team has come.
Bonus Element: Progress Tracking
In many modern Gantt tools, you can visually track how far a task has progressed. This is often represented by shading a portion of a task bar or using a percentage indicator (e.g., 60% complete).
Progress tracking helps:
- Spot tasks falling behind schedule
- Communicate status updates in visual terms
- Keep project momentum steady by making work feel visible and measurable
Managers often pair this with team check-ins or software integrations that auto-update based on task activity.
Together, these core components transform your Gantt Chart from a simple bar chart into a dynamic project control system. When used well, they provide both macro- and micro-level visibility, helping teams avoid confusion and deliver results in a structured, timely manner.
Building a Gantt Chart from Scratch
Let’s say you’re managing a website redesign. Here’s how to build a Gantt Chart step-by-step:
Step 1: Define Your Project Scope
Start with a Work Breakdown Structure (WBS). Identify all tasks involved from start to finish. Be specific.
Example WBS for Website Redesign:
- Research user needs
- Design wireframes
- Develop site architecture
- Write content
- Code front and back end
- Test and deploy
Step 2: Sequence the Tasks
Determine which tasks must happen first and which can run in parallel. Use dependencies to establish a logical flow.
Step 3: Estimate Duration
Assign realistic durations to each task. Buffer time should be added to account for approvals or testing cycles.
Step 4: Assign Responsibilities
Each task should have a responsible team or individual. This allows better accountability and resource planning.
Step 5: Choose a Gantt Chart Tool
Several tools make it easy to create and share Gantt Charts:
- Microsoft Project
- Asana (with Gantt view or Timeline)
- Excel or Google Sheets (for simple projects)
Step 6: Populate and Adjust
Once the data is in, the Gantt Chart begins to take shape. Add task bars, set dependencies, and adjust start or end dates as needed.
Gantt Chart Strategies
For experienced project managers, a Gantt Chart can be more than a timeline. It can become a dynamic control panel for project execution. Here’s how to elevate your usage:
1. Layer Resource Planning
Overlay team schedules or resource availability to avoid overloading individuals or delaying work due to staff shortages.
2. Baseline Tracking
Establish a baseline when the project begins. This serves as your original schedule. You can later compare actual progress against it to measure schedule variance.
3. Critical Path Highlighting
Critical Path Method (CPM) identifies the sequence of dependent tasks that determine the shortest project duration. Delay on any of these tasks will delay the whole project. Highlighting this on your Gantt Chart keeps you focused on what matters most.
4. Color Coding by Category
Use visual coding to group tasks, by phase, team, or status. For example, blue for design, green for development, gray for pending. This visual structure improves readability.
5. Progress Indicators
Modern tools allow you to mark how much of each task is complete, either through shading the task bar or numeric percentage. This helps stakeholders understand real-time project health.
When Gantt Charts Excel
Gantt Charts are especially effective in these project types:
- Construction Projects: Highly sequential, with clear dependencies and resource constraints.
- Software Development (Waterfall): When stages like planning, building, testing, and deployment follow a set order.
- Event Planning: Where timelines are crucial, and everything must be coordinated before a fixed date.
- Marketing Campaigns: Coordinating copy, design, approvals, and launch across departments.
- Product Launches: From prototyping to go-live, Gantt Charts ensure no step is missed.
Gantt Chart Pitfalls and How to Avoid Them
While Gantt Charts offer structure, complexity can grow quickly. Here’s how to manage that:
- Break down large tasks into sub-tasks for clarity
- Regularly update the chart to reflect current status
- Avoid micromanaging. Gantt Charts should support autonomy, not hinder it
- Keep communication lines open between teams to handle shifting priorities
Integrating Gantt Charts with Agile Environments
You may wonder—do Gantt Charts still work in Agile projects? They can, with some adaptation.
In Agile environments, sprints, backlogs, and flexibility are key. While traditional Gantt Charts emphasize fixed timelines, modern teams use hybrid models. For instance:
- Use Gantt Charts at the program or release level to plan high-level milestones
- Integrate with Kanban or Scrum boards for day-to-day task tracking
- Keep durations short and allow frequent updates to adapt to iterative progress
Gantt doesn’t have to clash with Agile. It can provide a structured view above the sprint-level chaos.
Final Thoughts: Making the Most of Your Gantt Chart
At its core, a Gantt Chart is not just a scheduling tool. It’s a communication platform. It brings together strategy, tasks, people, and time into one visual language. When built well, it removes uncertainty, boosts team confidence, and increases the chance of project success.
Use it during kickoff meetings to align expectations. Revisit it during weekly check-ins to guide priorities. Present it to stakeholders to show progress. The chart evolves with your project, acting as both a map and a mirror.
A well-crafted Gantt Chart keeps your team on track, your goals transparent, and your project momentum steady.