


Hidden Factory: 7 Powerful Truths That Expose Costly Rework

This article expands on a short post we shared on LinkedIn about the hidden factory. Readers there are already swapping the rework loops hiding in their own operations. Add yours to that thread, then read the full breakdown below.
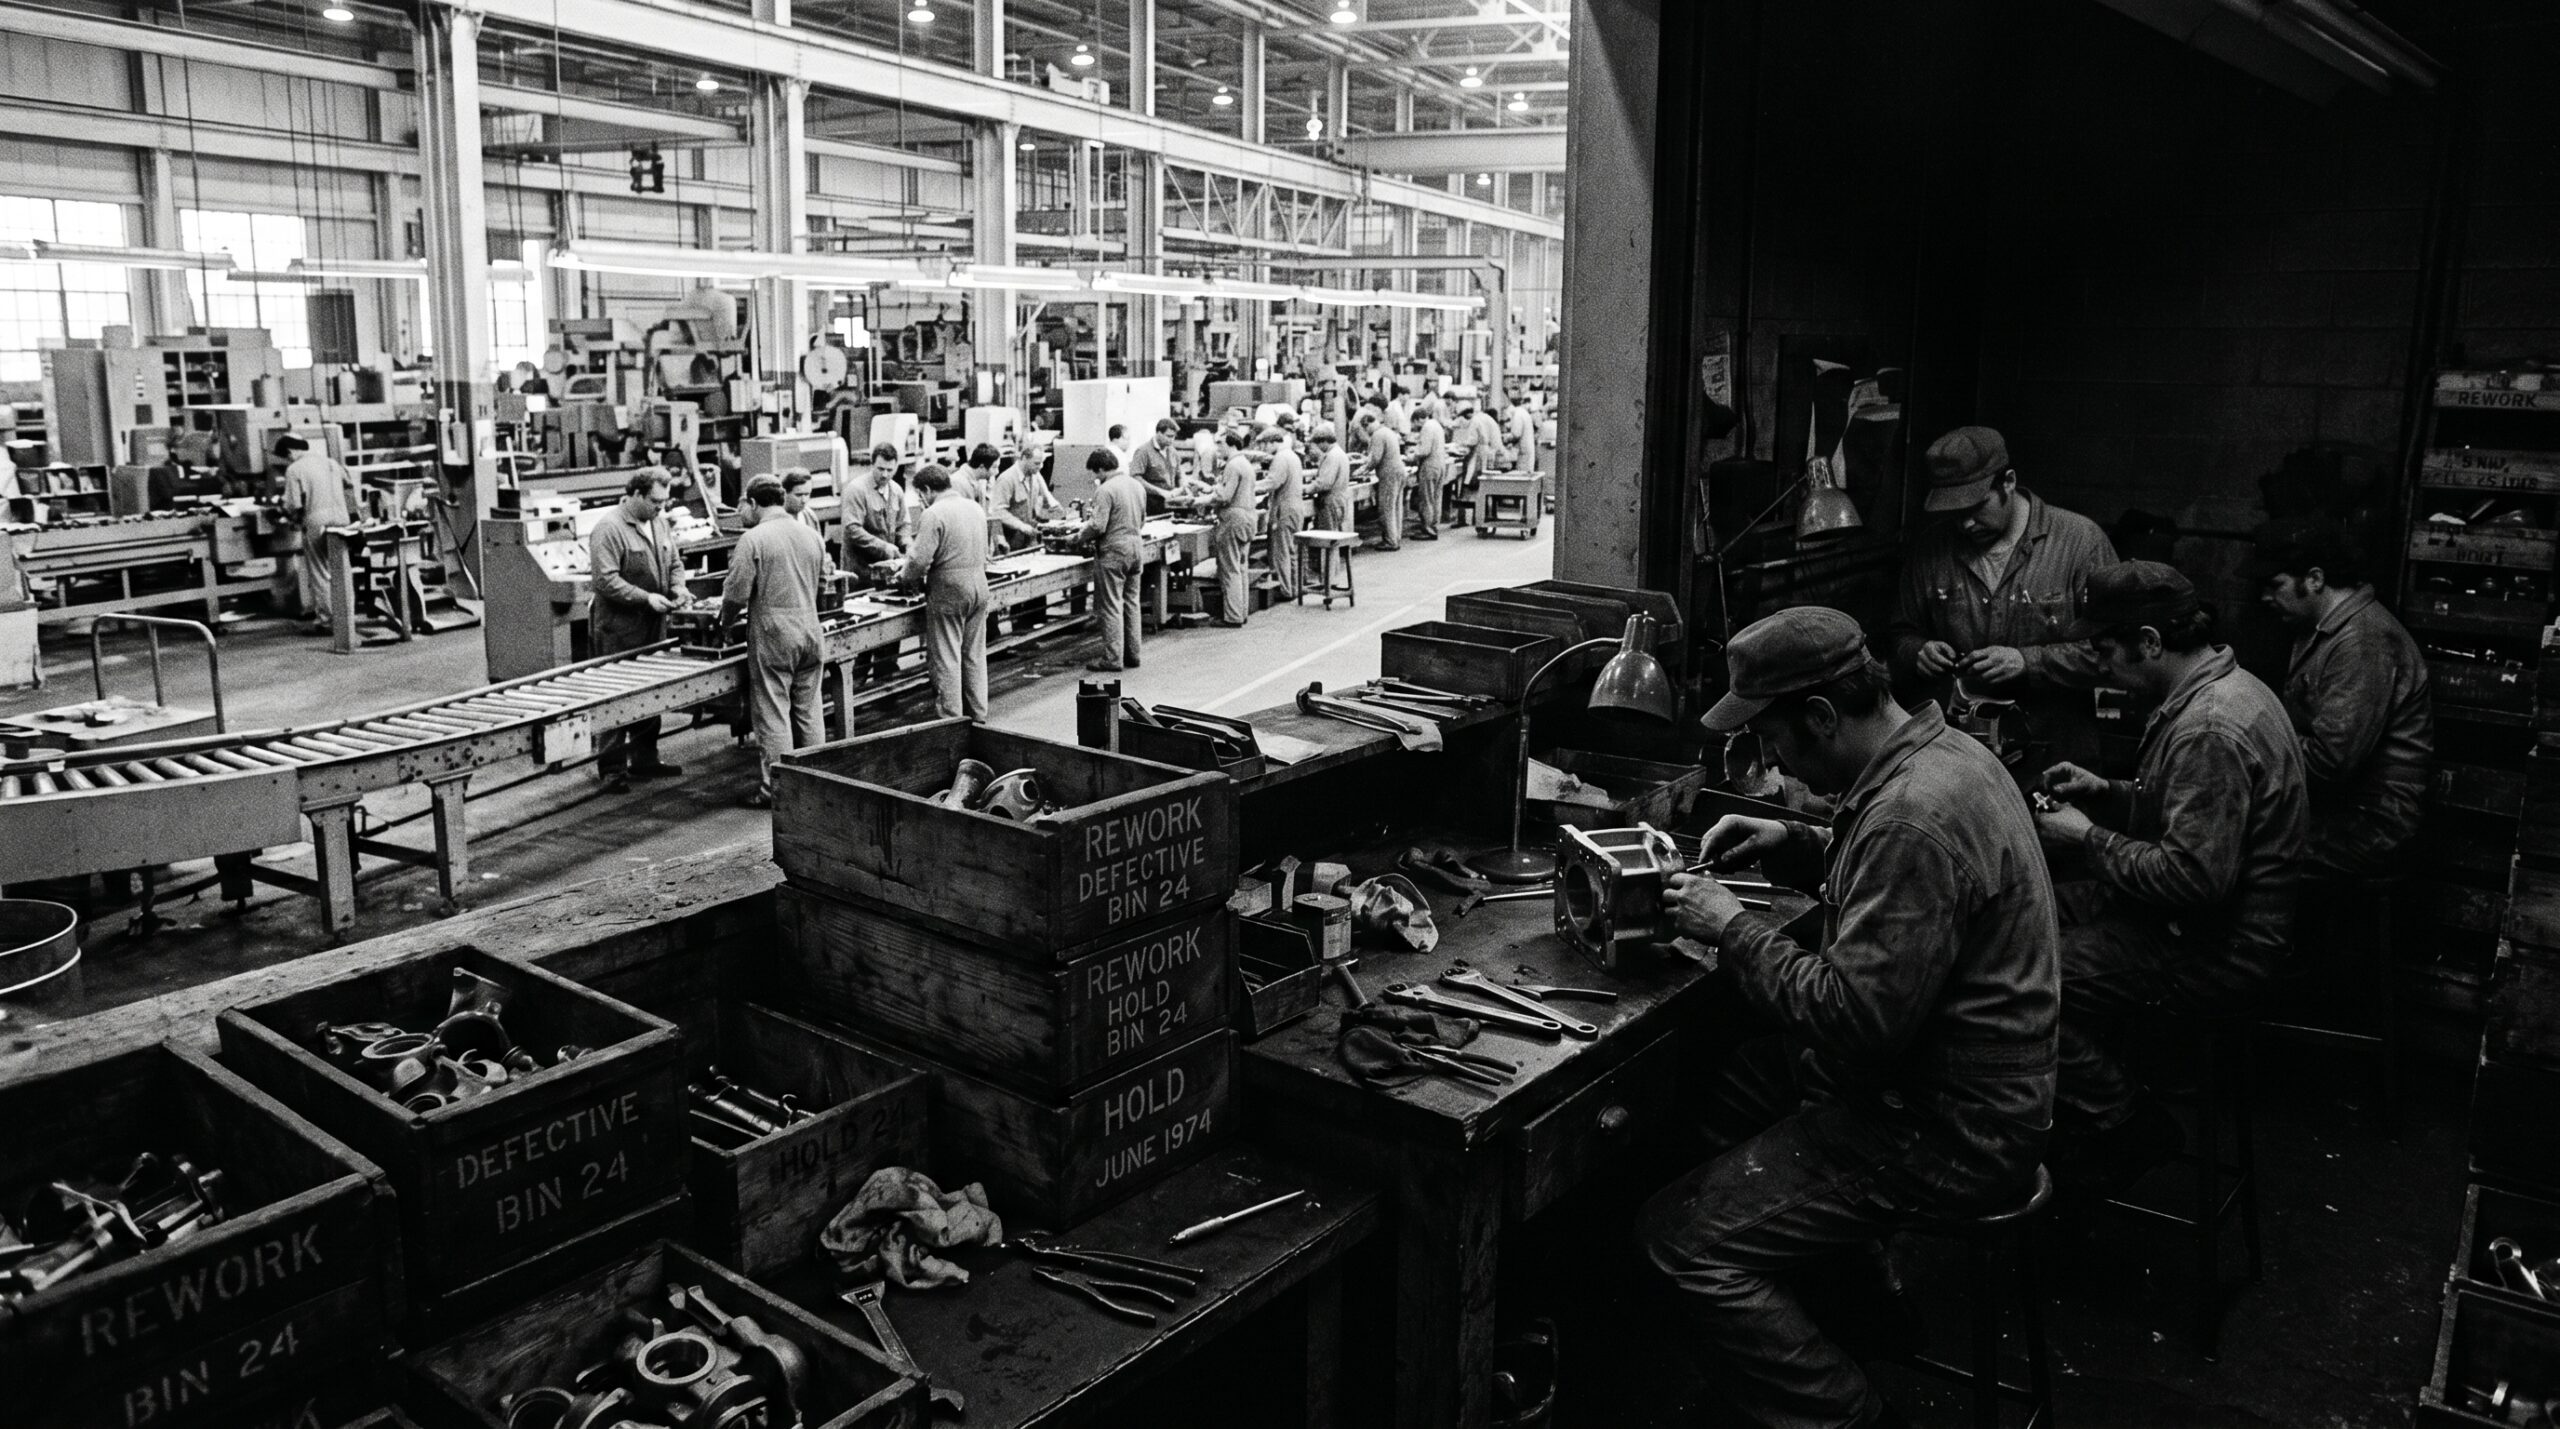
Walk any plant, hospital, or software team that looks like it is performing well, and you will usually find a second operation running quietly inside it. It makes nothing new. It exists only to catch and fix the work the first operation got wrong. Nobody planned it, nobody budgeted for it, and almost nobody measures it. Yet it can swallow a third or more of everything you produce.
This is the hidden factory, and once you learn to see it, you cannot unsee it. At AIGPE we keep returning to one belief: do not blame the people, fix the system and the root cause. The hidden factory is the clearest proof of why that belief matters, because it is built almost entirely by good people working hard to protect the customer from a process that was never set up to get it right the first time.
7 Insights at a Glance
If you only have ninety seconds, here are the seven things about the hidden factory worth remembering.
- It is a real, parallel operation, not a metaphor. This is the labor, time, materials, and floor space consumed purely by rework, re-inspection, re-testing, and scrap.
- Dr. Armand Feigenbaum named it in the 1970s. He called it the “hidden plant” and estimated it consumes 15 to 40 percent of a company’s total capacity.
- It hides because of how we measure. First pass yield makes every step look excellent, while rolled throughput yield reveals the true end-to-end loss.
- It is the operational face of the Cost of Poor Quality. Most of it is funded by internal failure costs that traditional accounting buries inside overhead.
- It lives everywhere, not just on factory floors. Claim denials in hospitals, debug cycles in software, and unbilled rework in professional services all qualify.
- You shrink it by fixing the root cause, not by working harder. Pushing an incapable process only feeds the rework loops faster.
- Mistake-proofing is the most permanent cure. When a defect cannot happen, the rework that depended on it disappears.
Table of Contents
- What Is the Hidden Factory?
- Key Facts at a Glance
- Where the Hidden Factory Came From
- Why the Hidden Factory Stays Invisible
- What the Hidden Factory Really Costs
- The Hidden Factory Beyond the Shop Floor
- How to Find and Measure It
- How to Shrink the Hidden Factory
- Frequently Asked Questions
What Is the Hidden Factory?
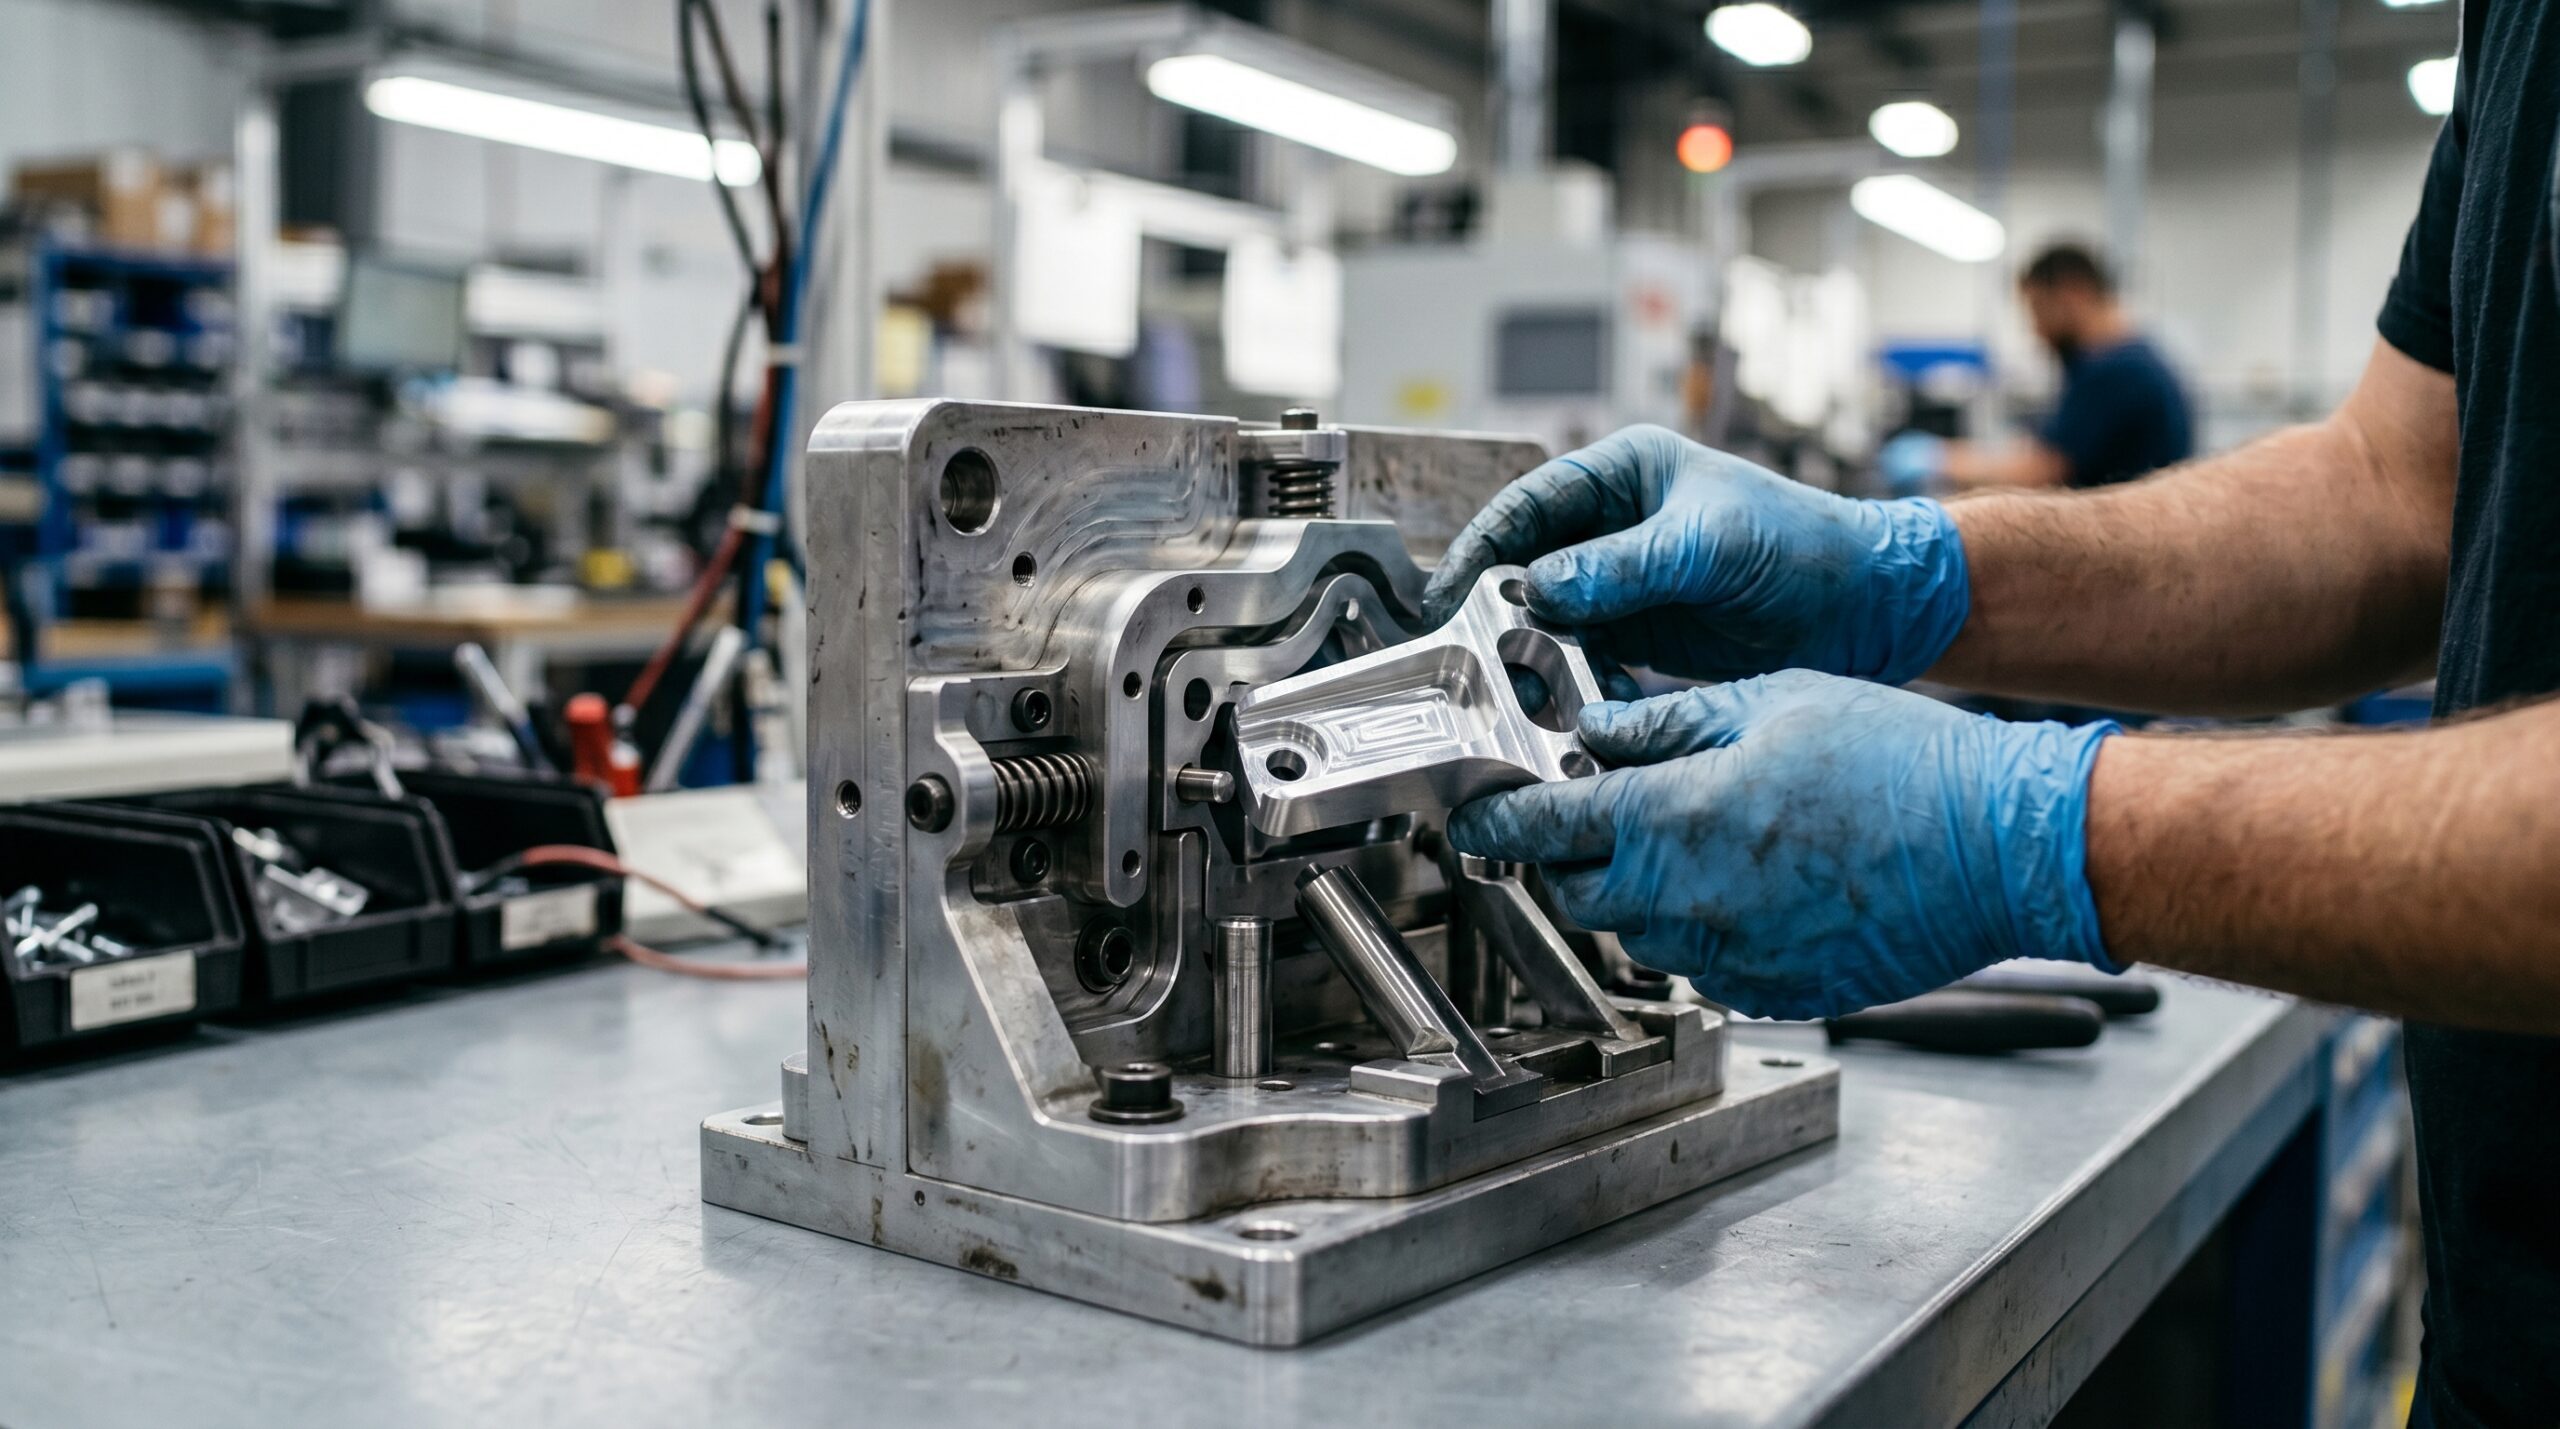
The hidden factory is the unseen part of any operation that exists solely to correct errors that should never have occurred. It is the rework bench, the second inspection, the re-test, the re-keyed data, and the quietly scrapped batch. Because the final output eventually meets the customer’s specification, standard reports record a success, while the cost of getting there stays invisible.
It is not the same as ordinary inefficiency. A machine running slowly because it is old is a known, visible loss. The hidden factory is different: it is active human or system effort spent shielding the customer from a process that is fundamentally incapable of getting things right the first time. As MIT Sloan’s John Carrier puts it, these workarounds cause the real factory floor to drift away from the one the engineers designed.
The one line to remember: the hidden factory is the price you pay, again and again, for not getting it right the first time.
Key Facts at a Glance
| Attribute | Detail |
|---|---|
| Also known as | Hidden plant, ghost factory, invisible factory |
| Named by | Dr. Armand V. Feigenbaum (the “hidden plant”), 1970s |
| Typical size | 15 to 40 percent of total productive capacity |
| What funds it | Internal failure costs within the Cost of Poor Quality (COPQ) |
| Key exposing metric | Rolled Throughput Yield (RTY) versus First Pass Yield (FPY) |
| Primary cure | Root-cause removal and mistake-proofing (poka-yoke) |
| Where it appears | Manufacturing, healthcare, software, logistics, professional services |
Where the Hidden Factory Came From
The concept traces to Dr. Armand V. Feigenbaum, the quality engineer who led manufacturing operations and quality control at General Electric and originated the idea of Total Quality Control. In his expanded work in the late 1970s, he described how “a certain hidden and nonproductive plant exists to rework and repair defects and returns,” and argued that if quality improved, that hidden plant would be freed up for real productivity. His estimate that it consumed 15 to 40 percent of capacity was treated as unbelievable at the time, and has been validated repeatedly since.
There is a second strand to the story. In 1985, Jeffrey Miller and Thomas Vollmann published “The Hidden Factory” in the Harvard Business Review, using the term to explain how transaction-driven overhead, not direct production volume, was the real engine of cost. Feigenbaum gave us the quality and rework idea; Miller and Vollmann cemented the phrase into management accounting. A common myth credits H. James Harrington with coining the term, but his major work on poor-quality cost came later, in 1987.
| Claim | Status |
|---|---|
| Feigenbaum named the “hidden plant” (15 to 40% of capacity) | Verified |
| Miller & Vollmann used “The Hidden Factory” for overhead cost (HBR, 1985) | Verified |
| H. James Harrington coined the term | Unverified / conflicts with the timeline |
| “Ghost factory” means only a rework workshop | Contested: now also used for automated “dark” factories |
Why the Hidden Factory Stays Invisible
The hidden factory survives because of a measurement blind spot. Most teams track first pass yield (FPY), which is how often a single step is done right the first time. If each step passes 95 percent of units, every department looks excellent and everyone earns their bonus.
But a process is a chain, not a single step. Rolled throughput yield (RTY) asks a harder question: what is the probability that a unit passes through every step cleanly, with no rework anywhere? It is the product of the individual yields. Run ten steps at a “great” 95 percent each, and the math is unforgiving.

| Number of steps (each at 95% FPY) | Rolled Throughput Yield | Sent into the hidden factory |
|---|---|---|
| 1 step | 95% | 5% |
| 5 steps | ~77% | ~23% |
| 10 steps | ~60% | ~40% |
| 20 steps | ~36% | ~64% |
At ten steps, roughly 40 percent of units were defective somewhere and quietly fixed. The plant did not suddenly get worse. It simply started measuring honestly. The gap between FPY and RTY is the size of your hidden factory.
What the Hidden Factory Really Costs
The hidden factory is the operational body of the Cost of Poor Quality. Feigenbaum’s quality-cost model splits spending into prevention, appraisal, internal failure, and external failure. It is funded mostly by internal failure costs: the scrap, rework, re-inspection, and re-testing caught before the customer sees them. Traditional accounting files these under general overhead, which is exactly why they stay hidden.
| Quality cost category | What it pays for | Link to the hidden factory |
|---|---|---|
| Prevention | Training, design, process capability | Shrinks it |
| Appraisal | Inspection and testing | Feeds it (excess inspection) |
| Internal failure | Scrap, rework, re-test before shipping | Builds it |
| External failure | Warranty, recalls, lost customers | What it tries to prevent |
The scale is striking. McKinsey partner Ron Ritter has noted that without constant discipline, a “hidden factory of latent capacity normally waits in everyday operations,” and finding it typically produces a 20 to 30 percent boost in output right away. A 2011 action-research study of a continuous-manufacturing firm found hidden quality costs of 8.78 percent of sales, which combined with visible costs reached 14.42 percent of sales, a figure that exceeded the company’s entire net profit. That rework, in effect, was consuming the whole profit margin.
The Hidden Factory Beyond the Shop Floor
This is not a manufacturing problem. It is a process problem, and processes are everywhere.

| Sector | What the hidden factory looks like | Documented result |
|---|---|---|
| Medical devices (Vyaire) | Undocumented bottlenecks and workarounds on a ventilator line | ~300% output gain before any new equipment, scaling toward 1,000+ units/day |
| Healthcare (Mercy) | Reworking denied insurance claims in the back office | Rework down 62%; denials from 4.1% to 2.0%; $5.3M net impact |
| Software | Undocumented debug scripts forcing unstable code through quality gates | Masked technical debt, lost engineering hours |
| Professional services | Unbilled hours fixing formatting, finding files, redoing junior work | Silent collapse of project profitability |
The Vyaire and Mercy cases are especially instructive. At Vyaire during the early pandemic, teams walked the floor with stopwatches and stripped out informal workarounds, tripling output without buying a single new machine. At Mercy, a Six Sigma team used process mapping and root-cause analysis to mistake-proof the front-end data collection, so the claims stopped being wrong in the first place.
How to Find and Measure It
Because the financial statements are structurally blind to it, you have to go looking. Four practical methods surface the hidden factory.
| Method | What it reveals |
|---|---|
| Rolled Throughput Yield (RTY) | The true end-to-end loss hidden behind step-level yields |
| Overall Equipment Effectiveness (OEE) | Capacity lost to defects and slow cycles at the machine level |
| Value Stream Mapping at the Gemba | The physical location of rework loops, inspection stations, and red-tag inventory |
| Industry 4.0 sensors and cycle-time data | Real-time anomalies where operators deviate to perform undocumented fixes |
The most uncomfortable of these is RTY, because it forces an honest number. When a plant shifts from reporting a comfortable 95 percent final yield to a 60 percent RTY, leaders often feel performance has collapsed. It has not. The rework was always there. It has simply been quantified, and now it can be targeted.
How to Shrink the Hidden Factory
You do not shrink it by pushing people harder. Driving more volume through an incapable process simply creates more defects to fix, and the rework loops grow. The cure is structured improvement that removes the source of the defect.
The Six Sigma DMAIC method dismantles the hidden factory step by step: Define the suspected rework loop, Measure its true volume with a baseline RTY, Analyze the upstream root cause with tools like the 5 Whys and Fishbone diagrams, Improve by fixing that cause, and Control the gain so the workaround cannot quietly return. The most permanent move is mistake-proofing (poka-yoke): engineer the step so the error is physically or digitally impossible. A form that rejects an invalid entry, or a fixture that only accepts a part one way, removes the defect and the rework together.
In the AI era, this gets faster. Tools that accelerate root-cause analysis and pattern detection can flag where rework concentrates long before a quarterly report would. The principle does not change: AI helps you find the hidden factory sooner, but human judgment still has to fix the system that created it.
Build the Skills That Expose the Hidden Factory
Seeing the hidden factory is a skill, and so is removing it. These AIGPE certifications build exactly that capability.
Lean and Six Sigma Track
- Certified Lean Six Sigma Green Belt
- Certified Value Stream Mapping (VSM) Specialist
- Certified Mistake-Proofing (Poka-Yoke) Specialist
- Certified Process Mapping Specialist
AI-Powered Track for Quality 4.0
- Certified AI-Powered Root-Cause Analysis Specialist
- ChatGPT and Six Sigma: AI Visualization Beginner
Frequently Asked Questions
What is the hidden factory in simple terms?
The hidden factory is the invisible part of an operation that exists only to fix mistakes: the rework, re-inspection, re-testing, and scrap. It uses real people, time, and materials, but never shows up as its own line on any report.
Who coined the term hidden factory?
Dr. Armand Feigenbaum described the “hidden plant” in the 1970s, focused on rework and quality failures. Jeffrey Miller and Thomas Vollmann popularized “The Hidden Factory” in a 1985 Harvard Business Review article about overhead costs.
How big is the hidden factory?
Feigenbaum estimated 15 to 40 percent of total capacity, and consultancies such as McKinsey report that exposing it often yields a 20 to 30 percent output gain. The exact figure depends on how many steps a process has and how capable each one is.
How is the hidden factory measured?
The clearest tool is rolled throughput yield (RTY), the product of each step’s first pass yield. The gap between high step-level yields and a much lower RTY shows how much work is being diverted into rework.
How do you reduce the hidden factory?
Use DMAIC to find and remove the upstream root cause, then mistake-proof the step so the defect cannot recur. Working harder on an incapable process makes the hidden factory bigger, not smaller.
Does the hidden factory exist outside manufacturing?
Yes. It appears in healthcare claim denials, software debug cycles, warehouse re-checks, and unbilled rework in professional services. Anywhere there is a process, a hidden factory can form.
About the Author
Rahul Iyer is a Master Black Belt and the founder of AIGPE, the Advanced Innovation Group Pro Excellence. AIGPE has trained over 1,000,000 professionals across 193 countries. All AIGPE programs are accredited by the CPD Standards Office (Provider 50735), the Project Management Institute (PMI Provider 5573), and the Society for Human Resource Management (SHRM Provider RP9220). His work sits at the intersection of Operational Excellence and Enterprise AI, helping professionals apply rigorous quality methodology while deploying AI with governance, clarity, and measurable ROI. Connect with Rahul on LinkedIn for Lean, Six Sigma, Project Management, and AI insights.
Citations and References
- IndustryWeek, Dr. Armand Feigenbaum on the Cost of Quality and the Hidden Factory
- Harvard Business Review, “The Hidden Factory,” Miller & Vollmann (1985)
- MIT Sloan, How to Find and Fix Hidden Factories
- McKinsey & Company, A Manufacturing Moonshot (Vyaire ventilator scale-up)
- Tulip Interfaces, The Hidden Factory: 5 Things You Should Know
- IISE, Reducing Insurance Claim Denials and Revenue Write-Offs (Mercy)