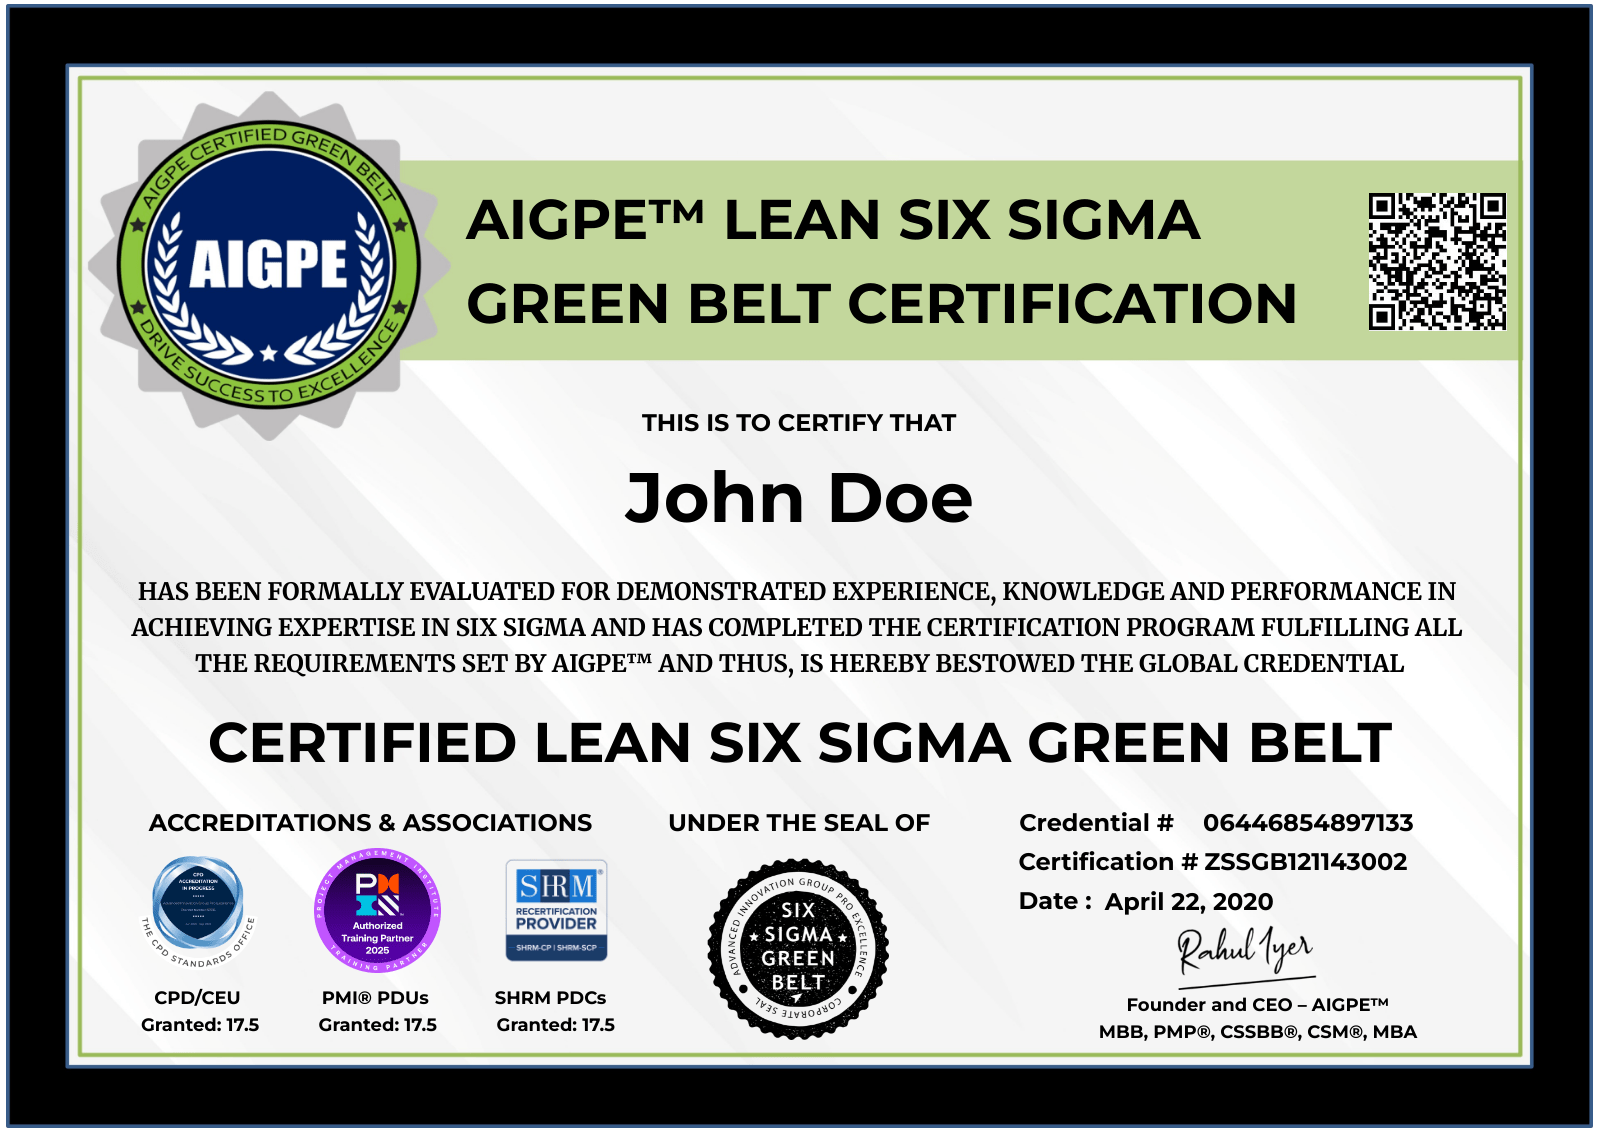
The AIGPE Green Belt Body of Knowledge is a combination of a wide variety of Lean Six Sigma concepts, tools, and techniques. This Body of Knowledge is universal, practically driven, and represents core competencies needed by a Lean Six Sigma professional.
This Certification Program is CPD Accredited.
AIGPE Six Sigma Body of Knowledge for Green Belts
1.1 Introduction
1.1.1 What is Quality?
1.1.2 BPR and Six Sigma - A Comparison
1.1.3 What is Six Sigma?
1.1.4 History of Six Sigma
1.1.5 What is Sigma?
1.1.6 The Focus of Six Sigma, Y = f(x)
1.1.7 Six Sigma: Role Player
1.1.8 What is Lean?
1.1.9 What is Kaizen?
1.1.10 The Cause-Solution Matrix
1.1.11 What is Statistics?
1.1.12 Descriptive Statistics: Measures of Central Tendency
1.1.13 Descriptive Statistics: Measures of Spread/Dispersion/Variation
1.1.14 Process Problems and Characteristics of a Successful Project
1.1.15 Process Focus
1.1.16 DMAIC Steps
1.2 Understand Customer and Business Requirements
1.2.1 Define Your Customer
1.2.2 Difference between Needs and Requirements
1.2.3 Methods to capture the Voice of Customer
1.2.4 Affinity Diagram
1.2.5 Translating Needs to Requirements
1.2.6 Prioritize Requirements using Kano Analysis
1.2.7 CTQ Drilldown Tree
1.3 Complete the Project Charter
1.3.1 Project Charter
i. Business Case
ii. Problem Statement
iii. Goal Statement
iv. Scope Statement
v. Project Team
vi. Project Milestones
1.4 Project Acceptability and CAP Tools
1.4.1 ARMI
1.4.2 RACI
1.4.3 Threat vs. Opportunity Matrix
1.4.4 Stakeholder Analysis
1.4.5 Elevator Speech
1.4.6 Communications Plan
1.5 Complete High-Level As-Is Process Map
1.5.1 Process Mapping Overview
1.5.2 SIPOC
2.1 Identify What to Measure?
2.1.1 Difference between Efficiency Measures and Effective Measures
2.1.2 Cost of Poor Quality (COPQ)
2.1.3 8 Wastes
i. Defects
ii. Overproduction
iii. Waiting
iv. Non-Utilized Skills
v. Transportation
vi. Inventory
vii. Motion
viii. Excess Processing
2.1.4 What are Process Maps?
2.1.5 What are Value Stream Maps?
2.1.6 Takt Time
2.1.7 Types of Data - Continuous vs. Discrete
2.2 Plan and Collect Data
2.2.1 XY Matrix
2.2.2 Data Collection Plan
i. Performance Measures
ii. Operational Definition
iii. Stratification Factors
iv. Data Collection - Existing vs. New Data
v. How will the data be collected?
vi. Who will collect the data?
vii. When will the data be collected?
2.2.3 Sampling
i. Simple Random Sampling
ii. Stratified Random Sampling
iii. Systematic Sampling
iv. Cluster Sampling
v. Sample Size formula - Continuous Data
vi. Sample Size formula - Discrete Data
2.2.4 Measurement System Analysis (MSA)
i. Measurement System Analysis - Components of Variation
ii. Measurement System Errors
2.3 Determine Baseline Performance
2.3.1 What is Data Stability?
2.3.2 Run Charts
2.3.3 Normal Distribution
2.3.4 Central Limit Theorem
2.3.5 How to check Normality on Minitab?
2.3.6 Yield
i. Classic Yield
ii. First Time Yield
iii. Rolled Throughput Yield (RTY)
2.4 Determine Baseline Performance - Discrete Data
2.4.1 What is Sigma Shift?
2.4.2 What are Defects?
2.4.3 What is a Unit?
2.4.5 What are Defectives?
2.4.6 What is Opportunity for Errors?
2.4.7 Calculate Process Sigma Multiple for Discrete Data
2.5 Determine Baseline Performance - Continuous Data
2.5.1 What are Specification Limits?
2.5.2 Calculate Process Sigma Multiple for Continuous Data using Minitab
3.1 Identify Performance Gaps
3.1.1 Brainstorming
3.1.2 Fishbone Diagram
3.1.3 5 Why Analysis
3.2 Ascertain Critical Root-Causes
3.2.1 Pareto Chart
3.2.2 Box Plot
3.2.3 Scatter Plot
3.2.4 Multi-Voting
3.2.5 Control-Impact Matrix
3.3 Hypothesis Testing
3.3.1 Introduction Hypothesis Testing
3.3.2 Hypothesis Testing - Mechanism and Steps
3.3.3 Identify the Hypothesis Test
3.3.4 How do you write the Null and Alternative Hypothesis
3.4 What is P-Value?
3.4.1 Confidence Level
3.4.2 Significance Level
3.4.3 P-Value
3.4.4 Infer the Results
3.5 Parametric Tests
3.5.1 1-Sample t test
3.5.2 2-Sample t test
3.5.3 Paired t test
3.5.4 One-Way ANOVA
3.6 Variance Tests
3.6.1 1-Variance test
3.6.2 2-Variance test
3.6.3 Test of Equal Variances
3.7 Non-Parametric Tests
3.7.1 1-Sample Sign test
3.7.2 Mann-Whitney test
3.7.3 Mood's Median test
3.8 Correlation and Regression
3.8.1 What is Correlation?
3.8.2 Correlation vs. Causation
3.8.3 Correlation Coefficient
3.8.4 How to perform Correlation Analysis on Minitab?
3.8.5 How to perform Regression Analysis on Minitab?
3.9 Chi-Square and Proportion Tests | Hypothesis Testing Errors
3.9.1 Chi-Square test
3.9.2 1-Proportion test
3.9.3 2-Proportion test
3.9.4 Hypothesis Testing Errors
i. Type 1 or Alpha Error
ii. Type 2 or Beta Error
4.1 Generate, Prioritize and Select Solutions
4.1.1 Brainstorming
4.1.2 Benchmarking
4.1.3 Brainwriting
4.1.4 Assumption Busting
4.1.5 Modified Brainstorming Techniques
i. Analogy Technique
ii. Channeling Technique
iii. Anti-Solution Technique
4.2 Identifying Solutions - Lean Tools & Solution Selection Matrix
4.2.1 5S
4.2.2 Heijunka
4.2.3 Generic Pull
4.2.4 Autonomation (Jidoka)
4.2.5 Just-In-Time
4.2.6 Solution Selection Matrix
4.3 Pilot Solutions
4.3.1 What is a Pilot?
4.3.2 Implement Poka-Yoke (Mistake-Proofing)
4.3.3 Implement Failure Mode and Effects Analysis (FMEA)
4.3.4 Implementation Planning
4.4 Validate Impact of Solution(s)
4.4.1 Cost Benefit Reanalysis
4.4.2 Validate Measurement System
4.4.3 Process Capability Re-Analysis
5.1 Institutionalize the Solution(s)
5.1.1 Visual Management Boards
5.1.2 Team Huddles
5.1.3 Standard Operating Procedures (SOP)
5.1.4 Go Gemba
5.2 Statistical Process Control (SPC)
5.2.1 Control Charts
5.2.2 Control Limits vs. Specification Limits
5.2.3 Control Charts - In Control Processes
5.2.4 Seven Indicators of an Out-of-Control Process
5.3 Control Charts for Continuous Data
5.3.1 I-MR Chart
5.3.2 X bar R Chart
5.3.3 X bar S Chart
5.4 Control Charts for Discrete Data
5.4.1 np Chart
5.4.2 p Chart
5.4.3 c Chart
5.4.4 u Chart
5.5 Implement Control Plan
5.5.1 Control Plan
5.5.2 Process Owner Sign-off
5.6 Replicate and Share Best Practices
5.7 Celebrate and Recognize Success
5.8 Post-Implementation Review
5.9 Celebrate
