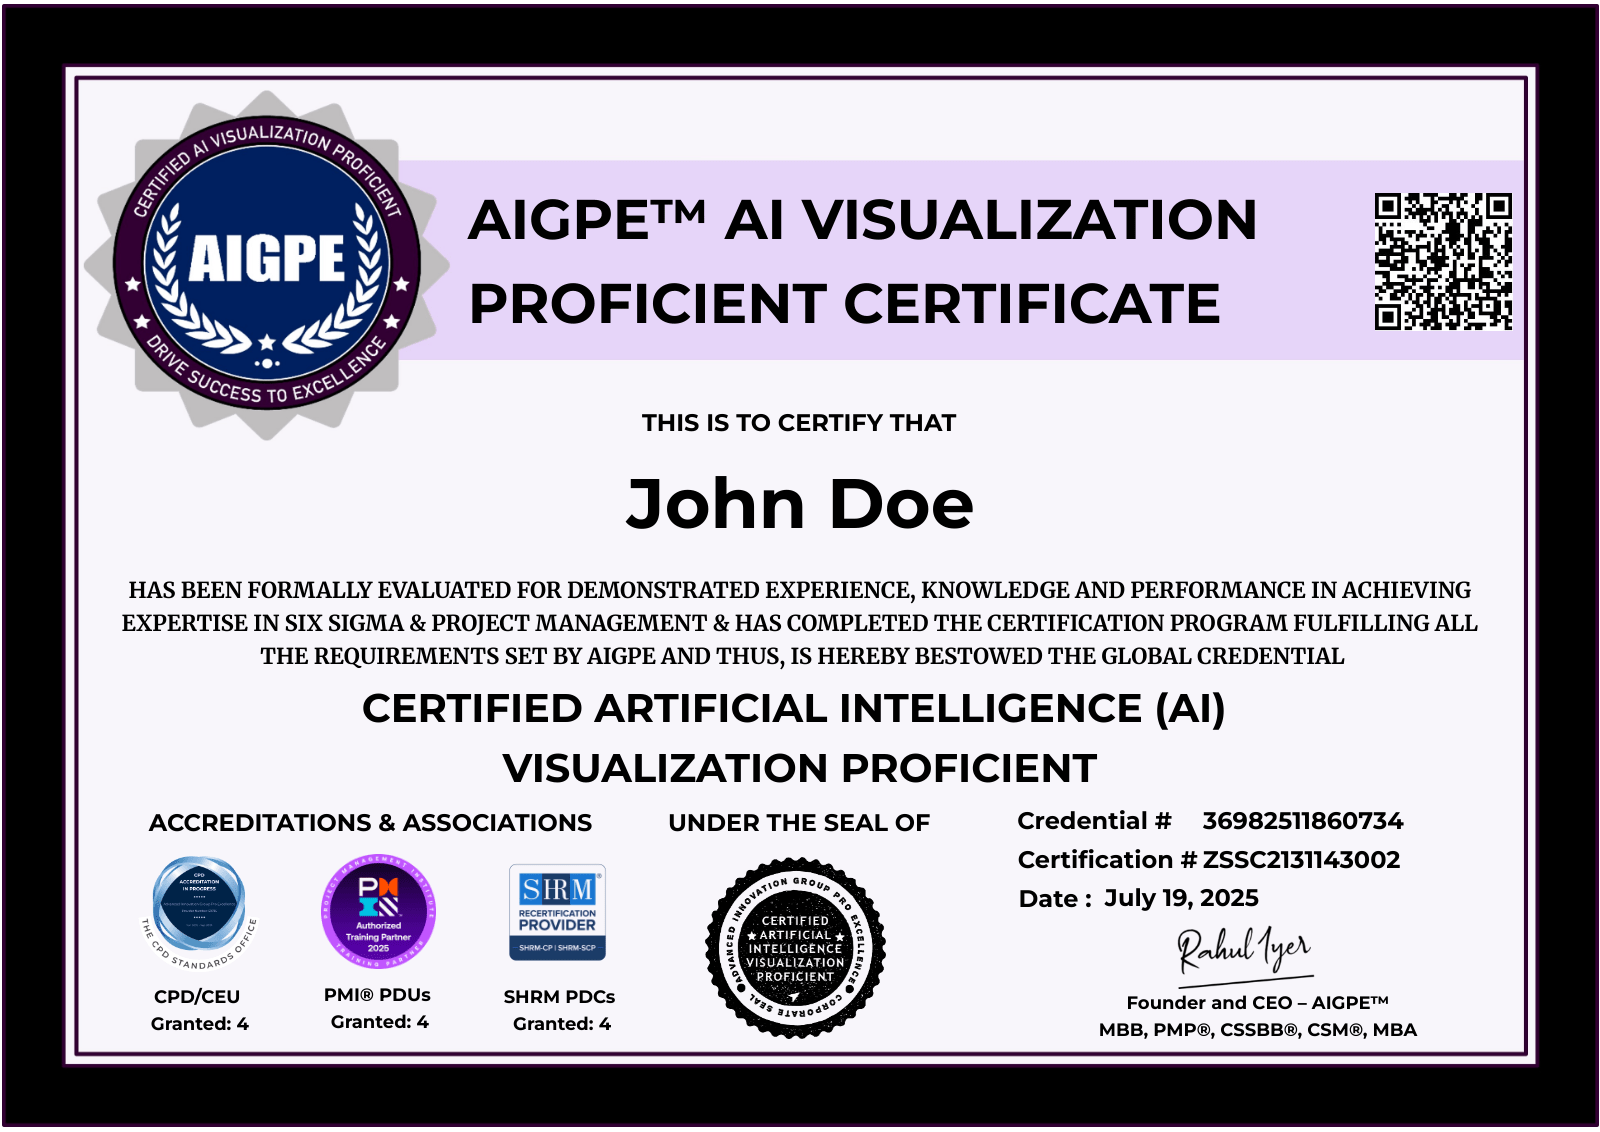
The AIGPE™ ChatGPT & Six Sigma: Certified AI Visualization Proficient Body of Knowledge is universal, practically driven, and represents core competencies needed by a Certified AI Visualization Proficient professional.
AIGPE™ Body of Knowledge | Certified AI Visualization Proficient
1.1 Course Introduction
1.2 Real-Life Anecdote - An Introduction
1.3 Reboot: The Innovatech Turnaround
1.4 The Turning Point: Rallying Innovatech
1.5 Recall the Basics
2.1 What is a Box Plot?
2.2 Business Case Study - Box Plot
2.3 Create a Box Plot using ChatGPT
2.4 Create a Box Plot using Julius AI
2.5 Business Case Study - Interpretations and Recommendations
2.6 Real-Life Anecdote : A Journey into Box Plots and Process Improvement
2.7 Real-Life Anecdote: Empowering You (Innovators): Using ChatGPT and Julius AI to Create Box Plot for Quality Analysis at Innovatech
2.8 Real-Life Anecdote: Creating a BoxPlot using ChatGPT & Julius AI
2.9 Real-Life Anecdote: Interpretations and Recommendations (Box Plot)
3.1 What is a Violin Plot?
3.2 Business Case Study - Violin Plot
3.3 Create a Violin Plot using ChatGPT
3.4 Create a Violin Plot using Julius AI
3.5 Business Case Study - Interpretations and Recommendations
3.6 Real-Life Anecdote : A Journey into Violin Plots and Process Improvement
3.7 Real-Life Anecdote: Empowering You (Innovators): Using ChatGPT and Julius AI to Create Violin Plot for Employee Engagement Analysis at Innovatech
3.8 Real-Life Anecdote: Creating a Violin Plot using ChatGPT & Julius AI
3.9 Real-Life Anecdote: Interpretations and Recommendations (Violin Plot)
4.1 What is a Pareto Chart?
4.2 Business Case Study - Pareto Chart
4.3 Create a Pareto Chart using ChatGPT
4.4 Create a Pareto Chart using Julius AI
4.5 Business Case Study - Interpretations and Recommendations
4.6 Real-Life Anecdote : A Journey into Pareto Charts and Process Improvement
4.7 Real-Life Anecdote: Empowering You (Innovators): Using ChatGPT and Julius AI to Create Pareto Chart for Department Expense Contributions Analysis at Innovatech
4.8 Real-Life Anecdote: Creating a Pareto Chart using ChatGPT & Julius AI
4.9 Real-Life Anecdote: Interpretations and Recommendations (Pareto Chart)
5.1 What is a Lollipop Chart?
5.2 Business Case Study - Lollipop Chart
5.3 Create a Lollipop Chart using ChatGPT
5.4 Create a Lollipop Chart using Julius AI
5.5 Business Case Study - Interpretations and Recommendations
5.6 Real-Life Anecdote : A Journey into Lollipop Charts and Process Improvement
5.7 Real-Life Anecdote: Empowering You (Innovators): Using ChatGPT and Julius AI to Create Lollipop Chart for IT Support Ticket Resolution Times Analysis at Innovatech
5.8 Real-Life Anecdote: Creating a Lollipop Chart using ChatGPT & Julius AI
5.9 Real-Life Anecdote: Interpretations and Recommendations (Lollipop Chart)
6.1 What is an Area Chart?
6.2 What is a Standard Area Chart?
6.3 Business Case Study - Standard Area Chart
6.4 Create a Standard Area Chart using ChatGPT
6.5 Create a Standard Area Chart using Julius AI
6.6 Business Case Study - Interpretations and Recommendations
6.7 Real-Life Anecdote : A Journey into Standard Area Charts and Process Improvement
6.7 Real-Life Anecdote: Empowering You (Innovators): Using ChatGPT and Julius AI to Create Standard Area Chart for Marketing Campaign ROI Analysis at Innovatech
6.9 Real-Life Anecdote: Creating a Standard Area Chart using ChatGPT & Julius AI
6.10 Real-Life Anecdote: Interpretations and Recommendations (Standard Area Chart)
7.1 What is a Stacked Area Chart?
7.2 Business Case Study - Stacked Area Chart
7.3 Create a Stacked Area Chart using ChatGPT
7.4 Create a Stacked Area Chart using Julius AI
7.5 Business Case Study - Interpretations and Recommendations
7.6 Real-Life Anecdote : A Journey into Stacked Area Charts and Process Improvement
7.7 Real-Life Anecdote: Empowering You (Innovators): Using ChatGPT and Julius AI to Create Stacked Area Chart for Product Line Revenue Contribution Analysis at Innovatech
7.8 Real-Life Anecdote: Creating a Stacked Area Chart using ChatGPT & Julius AI
7.9 Real-Life Anecdote: Interpretations and Recommendations (Stacked Area Chart)
8.1 Real-Life Anecdote - Conclusion
8.2 Course Conclusion


