
Cause and Effect Diagram for Root Cause Analysis
In business, problem-solving is a daily reality. Whether you’re managing a production line, handling customer complaints, or running a project behind schedule, decisions must be made fast and they must be right. But how do you ensure that your decisions are grounded in fact, not assumption?
Enter the Cause and Effect Diagram, also known as the Fishbone Diagram or Ishikawa Diagram. It’s more than just a visual tool, it’s a structured thinking process that sharpens decision-making by making root causes visible, traceable, and analyzable. In this blog, we’ll explore the power of this diagram and how it transforms reactive thinking into strategic action.
What Is a Cause and Effect Diagram?
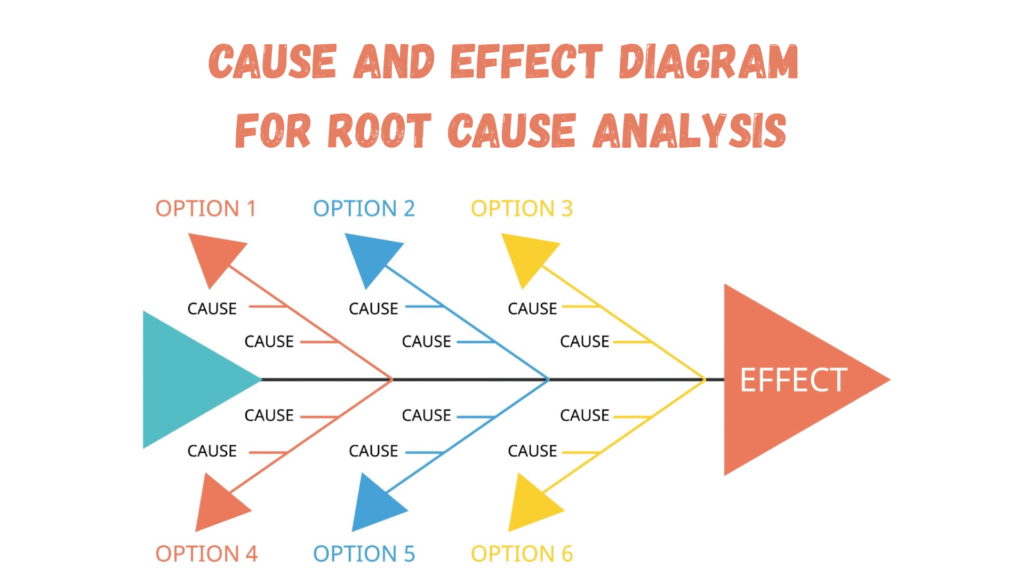
Imagine a fishbone. The problem you’re trying to solve is the “head,” and each “bone” represents a potential category of root causes like machinery, manpower, or materials. Under each of these bones, you can dig deeper, uncovering contributing factors.
This diagram was popularized by Kaoru Ishikawa, a Japanese quality control expert, in the 1960s. Since then, it has become a staple in Lean, Six Sigma, Total Quality Management (TQM), and various business improvement methodologies.
But why does it work so well? Because it forces structured thinking. It prevents you from jumping to conclusions or relying solely on gut instinct. Instead, it demands evidence, logic, and cross-functional collaboration.
Why Decision-Making Needs Visual Thinking
Most of us try to solve problems in our heads. But the human brain isn’t designed to hold dozens of variables and interactions at once. Complex issues, especially in systems with many moving parts, need to be mapped out to be understood.
A Cause and Effect Diagram is a way to externalize your thinking. It helps in:
- Breaking down complexity: You see not just the problem but all its possible roots, at a glance.
- Uncovering hidden causes: Sometimes the real cause isn’t where you first look.
- Reducing bias: By involving a team and sticking to categories, it avoids personal opinions from dominating.
- Following logic: Making decisions based on logic, not noise.
Core Components of the Diagram
This is the starting point of the Cause and Effect Diagram. It represents the problem statement, the observable outcome or issue that the organization wants to investigate and resolve.
Purpose:
Clearly defining the effect ensures that the analysis remains focused. A vague or general problem leads to scattered thinking and ineffective solutions. The effect must be:
- Specific: Avoid ambiguous terms. Name the exact issue.
- Measurable: Include data wherever possible to quantify the extent of the problem.
- Observable: The problem should be visible through real-world evidence, not just based on opinion or assumption.
Examples of Well-Defined Effects:
- “Customer return rate has increased from 8% to 15% in Q2.”
- “Product X’s launch has been delayed by three weeks due to incomplete QA testing.”
- “Machine downtime in production line B has exceeded two hours daily for the past month.”
A clear effect statement helps teams stay on track and enables better root cause identification.
2. The Bones (Major Cause Categories)
These are the primary branches that feed into the head of the diagram. They represent broad categories of potential causes that could be contributing to the effect. Each bone acts as a placeholder for specific root causes that fall under a common theme.
Traditional Cause Categories in Manufacturing – The 6Ms:
- Man (Personnel/People):
Refers to human-related causes such as operator error, lack of training, miscommunication, absenteeism, or fatigue. - Machine (Equipment):
Involves mechanical or technical issues—malfunctioning equipment, outdated technology, improper maintenance, or calibration errors. - Material:
Concerns about the quality, availability, or suitability of raw materials. Problems here could include defective materials, inconsistent supply, or substitutions that affect performance. - Method (Process):
Deals with how tasks are performed. Poorly defined processes, absence of standard operating procedures (SOPs), or inefficient workflows can contribute to errors. - Measurement:
Refers to the data, metrics, or tools used to monitor and control processes. Inaccurate instruments, flawed measurement systems, or lack of performance indicators can mislead decision-making. - Mother Nature (Environment):
Relates to external or environmental factors like lighting, temperature, humidity, workspace layout, or even unexpected weather events.
Alternative Categories for Services and IT – The 4Ps or 4Ss:
In non-manufacturing environments, the 6Ms may not be relevant. Instead, categories can be adapted to suit the domain.
- 4Ps (commonly used in services):
- People
- Policies
- Procedures
- Place
- People
- 4Ss (used in IT and software):
- Surroundings
- Systems
- Software
- Suppliers
- Surroundings
Key Principle:
The categories should be tailored to reflect the nature of your operations. If the categories do not resonate with the team’s actual work, they won’t be useful in uncovering real causes.
3. Sub-Causes (Smaller Bones)
Once the major categories are drawn, the next step is to identify specific contributing factors under each. These are the sub-causes, or the smaller bones branching off from the main bones.
Purpose:
These help drill down into details that may not be obvious at a high level. The goal is to break large issues into actionable parts and discover the actual reasons behind the observed effect.
Process:
- Ask, “What could cause this?” under each major category.
- Use techniques like the 5 Whys to dig deeper into each suspected cause.
- Be thorough, and avoid stopping at surface-level explanations.
Example:
If the main category is “Man (People)” and the effect is “Delayed order fulfillment,” the sub-causes might include:
- Inexperienced new hires
- Lack of proper training on the order management system
- Poor shift scheduling causing understaffing during peak hours
If the category is “Machine (Equipment)”:
- Printer used for shipping labels breaks down frequently
- Outdated inventory scanner causes barcode errors
- Conveyor belt pauses unpredictably due to sensor failure
Validation:
Each sub-cause should be backed by data or observations. This prevents the analysis from becoming speculative. Not every suspected cause will be valid, but documenting them helps create a comprehensive view.
Step-by-Step Guide to Using the Diagram
Step 1: Define the Problem Clearly
Start with a well-articulated effect. Avoid vague statements like “bad quality.” Instead, go for measurable outcomes—“25% increase in product defects in Q2.”
Step 2: Choose Cause Categories
Select categories that best represent your work environment. If you’re a software company, don’t stick with the 6Ms blindly. Adapt them.
Step 3: Brainstorm with a Team
Gather cross-functional members who can bring different perspectives. One person from operations, one from design, one from quality; this diversity is key.
Step 4: Drill Down
Under each major category, ask, “What could cause this?” Use the “5 Whys” technique to dig deeper.
For example:
- Category: Method
- Cause: Missing SOP
- Why? SOP not documented
- Why? Process owner left
- Why? No knowledge retention process
Soon, you’re no longer fixing symptoms, you’re fixing the system.
Step 5: Validate with Data
Don’t rely on assumptions. Once the diagram is filled, use data to test the validity of each suspected root cause. This is where decision-making becomes grounded.
Step 6: Prioritize and Act
You’ll likely have multiple root causes. Use tools like Pareto Analysis (80/20 rule) or Impact-Effort Matrix to prioritize what to fix first.
Practical Example: A Real-Life Scenario
Let’s say your company is receiving frequent customer complaints about delayed order deliveries.
Effect: “Order delivery delayed by 48+ hours for 40% of customers”
Categories Used: People, Process, Technology, Partners
Brainstorm Outcome:
- People: Inadequate training on new order system
- Process: No defined backup in case courier cancels pickup
- Technology: ERP system not syncing with logistics API
- Partners: Delivery vendor missing SLAs repeatedly
By visualizing these, your team realizes it’s not just a logistics issue—it’s a cross-functional failure. Now you can take informed action: retrain staff, add a second courier, update API protocols.
Best Practices for Using the Diagram
- Involve the Right People: Get perspectives from those closest to the problem. Leaders may see the big picture, but frontline employees live the details.
- Keep the Scope Focused: Don’t try to solve everything in one diagram. Each problem should have its own.
- Use Real Data: Gut feelings won’t cut it. Match every suspected cause with real metrics.
- Update the Diagram: It’s not a static tool. As new data comes in, revise your understanding of the problem.
- Use It with Other Tools: Combine it with 5 Whys, Pareto Charts, or Control Charts for deeper analysis.
Challenges You Might Face
While powerful, the Cause and Effect Diagram isn’t foolproof.
- Oversimplification: Some teams treat the diagram as a checklist rather than an analytical tool.
- Bias in brainstorming: Dominant voices might skew the analysis.
- Too many causes: If not scoped tightly, the diagram can become overwhelming.
- No follow-through: Mapping is only half the work; action and validation are what make it useful.
These can be avoided through facilitation, proper scoping, and leadership follow-up.
The Future of Visual Root Cause Analysis
As decision-making becomes faster and more data-driven, Cause and Effect Diagrams are evolving. Digital tools now integrate real-time data, machine learning, and collaborative features to enhance this analysis.
Some advanced platforms:
- Use AI suggestions to auto-populate likely causes.
- Integrate with IoT dashboards to show live cause-effect feedback loops.
- Allow remote collaboration, ideal for global teams.
Still, the principle remains the same: clarity leads to control. Whether drawn by hand or powered by AI, the value lies in making the unseen visible.
Conclusion: From Drawing to Doing
The Cause and Effect Diagram isn’t just a tool for engineers or quality teams. It’s a thinking method, one that applies to any decision-maker looking to solve problems at the root.
In today’s noisy, fast-paced world, clarity is a competitive advantage. And this simple fishbone structure, when used correctly, can guide your team from confusion to confidence, from reaction to resolution.
The next time you face a recurring issue, don’t guess. Draw it. Break it. Trace it. Solve it.